

Clipboard Health Case Study
Clipboard Health Case Study
Prompt: I'm the pricing product manager for Lyft’s ride-scheduling feature. The goal is to maximize net revenue for the next 12 months by adjusting Lyft's take rate.

Below are the 3 steps I took to approach this case study. Step 1 & 2 are qualitative analysis, step 3 is quantitative analysis:
Understanding the problem space and value propositions: I prioritized on discovering user pain points before building solutions, especially for marketing new features and creating a pricing model for the Toledo, OH market
Tackling the cold start problem and defining the tipping point: I developed a playbook on handling the cold start problem and identifying the network effect's tipping point. Also, outlined the vision of a successful ride-scheduling service in 12 months
Pricing analysis with 2 scenarios: Success defined as reaching network effect with a high match rate and low ETA per request. Scenario 1 focuses on maximizing net revenue for the next 12 months, while Scenario 2 proposes aggressive driver hiring, fare reduction, and increased commission to establish market dominance
[Bonus] Strategies for market share and profitability: I explored long-term incentivization channels to boost profitability beyond 12 months
1. Understanding the problem space and value propositions
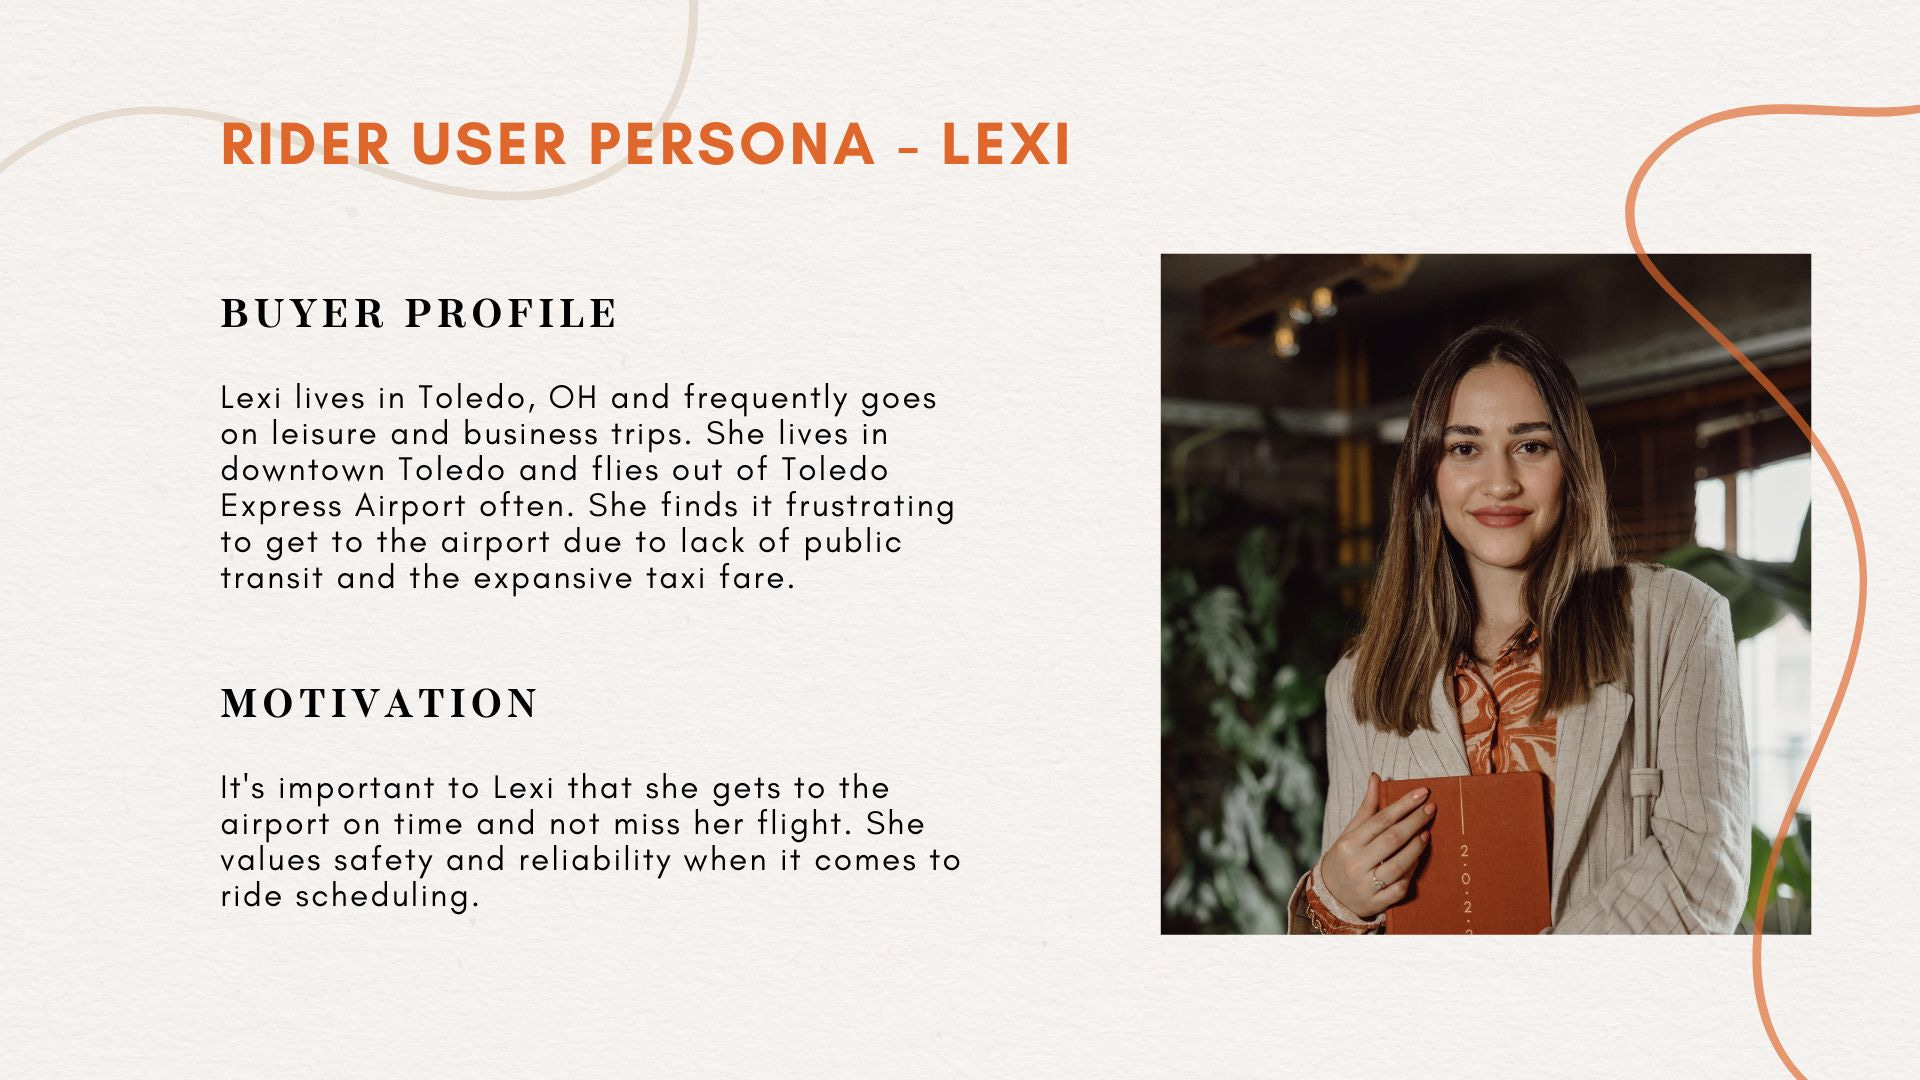
4 Current Alternatives and Pain Points for RIDERS:
Expensive and unreliable taxis in Toledo - With drivers blaming delays on low fares and limited service (not 24/7). Fares to the airport are significantly higher than Lyft. A taxi from downtown Toledo to the airport is ~$40, which is 60% more expansive than the $25 prevailing rate
Lack of public transit options - On Toledo Express Airport’s website, the only ground transportation option besides Uber/Lyft and car rental companies is Tarta Flex. There is neither public bus nor shuttle services. Unfortunately, Tarta Flex’s geographic coverage is limited and it does not service the route between downtown and the airport. The app only has 4 ratings on the app store with disappointing reviews
Self-parking at the airport is inconvenient and costly - especially for longer trips
Uber’s scheduled rides are not reliable - Assuming Uber is already in Toledo and launched the ride scheduling service before Lyft. One of the biggest complaints around Uber’s scheduled rides is its unreliability, leading to high cancellation rates and missed flights for riders. Below are the most common complains for Uber/Lyft’s ride-scheduling feature:
Scheduled ride cancelled: Scheduled ride cancelled and missed flight
No Show: Scheduled pickup no show
4 Value Propositions for RIDERS:
Riders want timely and guaranteed rides, crucial for catching flights, with a reliable and high match rate service
Riders want transparent pricing and in-app payment to avoid unpredictability and awkward payment exchanges
Riders want 24/7 scheduling availability to accommodate travel at any time
Riders want to ensure safety with mandatory DMV and background checks for Lyft drivers
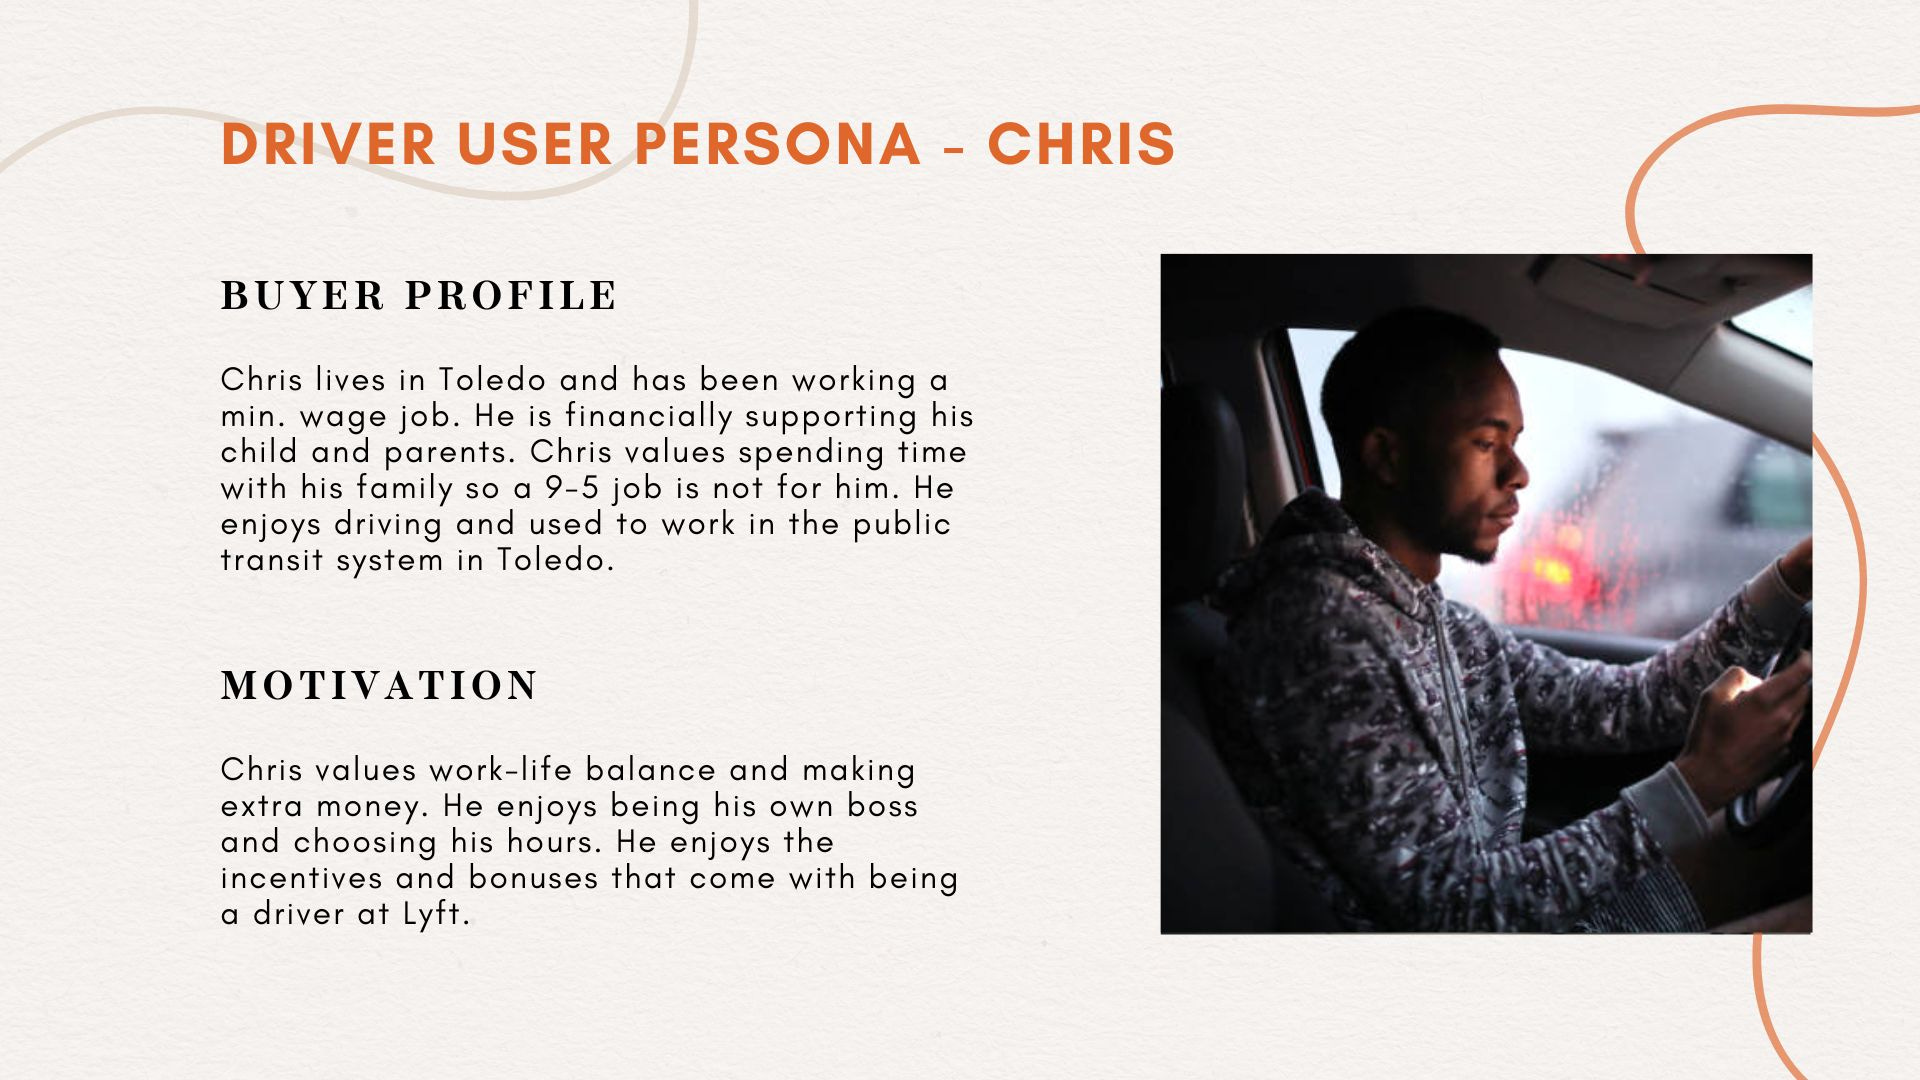
3 Current Alternatives and Pain Points for DRIVERS:
Low demand and earning power as a taxi driver due to competition from Uber and Lyft
Long idling times in taxi lines at the airport, leading to uncertainty about potential earnings
The increasing cost of living and inflation in Toledo, driving the need for additional revenue streams
3 Value Propositions for Drivers:
Drivers want an opportunity to earn extra income with flexible hours
Drivers want the ability to choose which rides to accept
Drivers want payout transparency before accepting any trips
2. Tackling the cold start problem and defining the tipping point
 | by Anvika | Medium")
Every marketplace has a hard and easy side. For Lyft, the hard side is the driver supply. To solve the cold start problem, onboarding initial supply is critical. To address the cold start problem, it is crucial to onboard a substantial number of drivers initially. My strategy involves aggressively acquiring drivers within the first 6 months to achieve market saturation, ideally during the peak tourism season from June to August in Toledo. Upon reaching this saturation point, we will implement measures to increase Lyft's revenue, reduce fares, and shift our focus towards profitability
Defining the tipping point and the ceiling:

Above chart is also sourced from “The Cold Start Problem” by Andrew Chen. He defined Uber’s tipping point in any city is when ETA is ~15 minutes. Market saturation is defined as ETA becomes ~5 minutes. At the ceiling, any additional drivers being acquired will not drive further conversion rate
Defining Success in Toledo, OH in 12 months
Toledo Airports handles 110 aircraft operations1 per day. There are approximately 60 arriving flights per day, with a total of ~200,000 passengers2 disembarked yearly. It’s fair to assume there are 400,000 Toledo Express Airport travelers. it can be estimated that, for an average small airport, more than 5% of travelers have transfer flights, thus resulting in 380,000 potential serviceable customers within 12 months, equating to an average of ~32,000 ride requests monthly3. Below are more macro growth trends on Toledo4
Downtown Toledo has 3 million visitors (national and international) visits the city each year
Downtown Toledo workforce has risen to 25.5k with a growth rate of 7% since 2015
Downtown Toledo has 3.7k residents growth rate at 12% since 2000
3. Pricing analysis with 2 scenarios
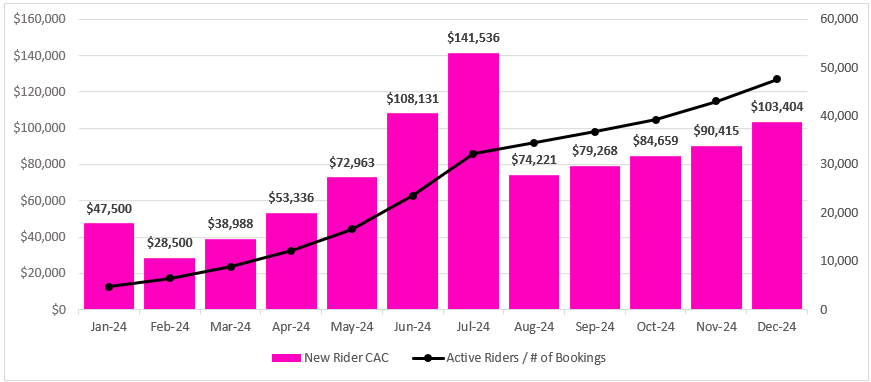
Net revenue is calculated as “passenger pay” - “driver payout”. Based on the net revenue sensitivity analysis below, there is a positive correlation between take rate, # of acquired riders, and net revenue.

Case study summary - how much more or less do you pay drivers per trip to maximize net revenue for the next 12 months:
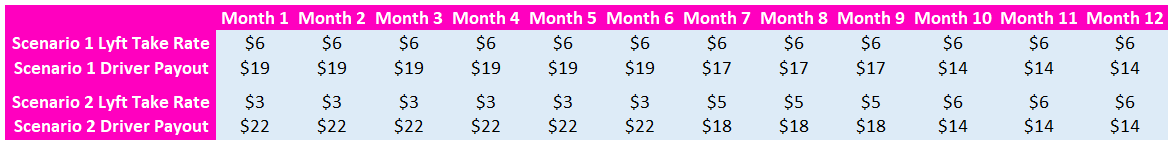
Scenario 1 - maximizing net revenue for the next 12 months
Scenario 2 - Establishing market dominance via aggressive driver hiring, fare reduction and increased commission

Key assumptions for both scenarios:
Seasonality - The peak tourism months in Toledo, OH are from June to mid-September. The plan is to reach market saturation in terms of rider demand by July to create operating leverage
Reaching demand saturation in 6 months - The objective is to adopt an aggressive user acquisition strategy in the initial 6 months to achieve 32,000 bookings per month by July (calculated as 380,000 annual travelers / 12 = ~32,000/mo) and maintain a steady rate thereafter. Once Market saturation is achieved, additional driver acquisition is not expected to further impact the conversion rate starting July
Creating operating leverage to drive churn improvement - Starting July once market saturation is reached, Lyft will have the pricing power to create operating leverage. Q3 fare is reduced to $22.5 with 5% improvement in churn. Q4 fare is reduced to $20 with an additional 2% improvement in churn.
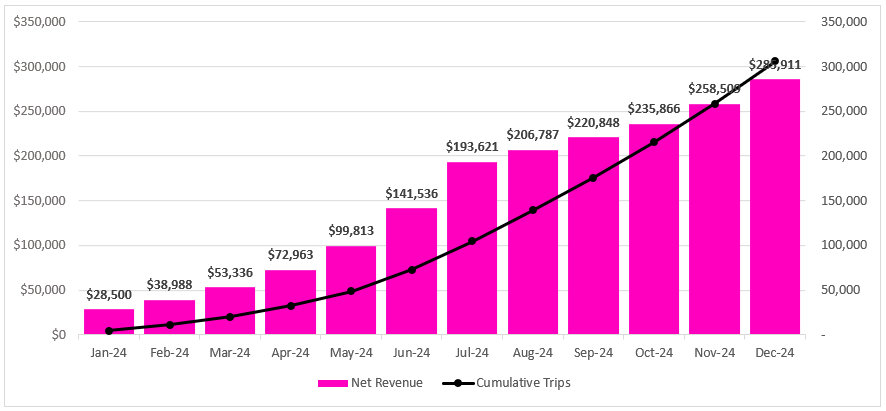
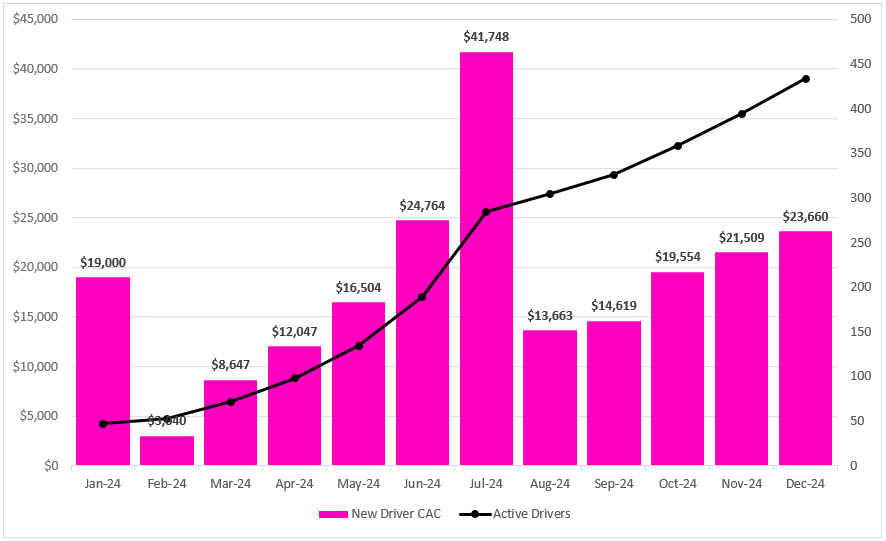
Scenario 1 - Maximizing net revenue for the next 12 months
In Scenario 1, the projected net revenue for the next 12 months is approximately $1.8MM. Key assumptions include:
No additional drivers (supply liquidity) will be acquired beyond fulfilling the demand with a ratio of 1 driver per 100 bookings to maintain supply-side liquidity
Throughout all months, Lyft's take rate will be $6, with a rider customer acquisition cost (CAC) of $10 and a driver CAC of $400, all aimed at maximizing net revenue


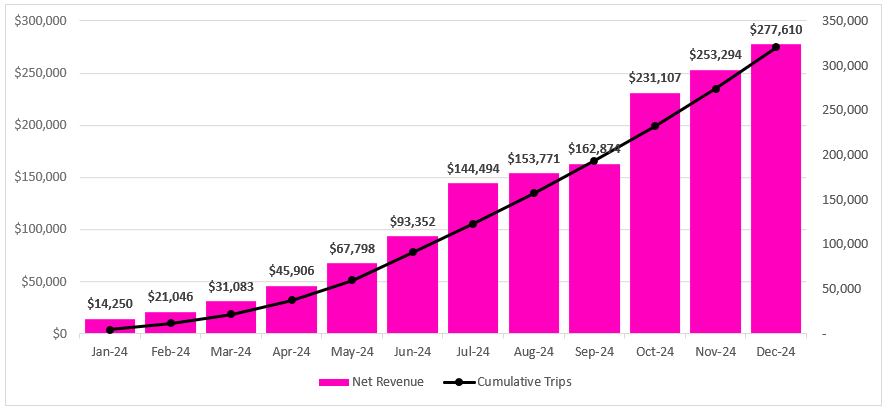
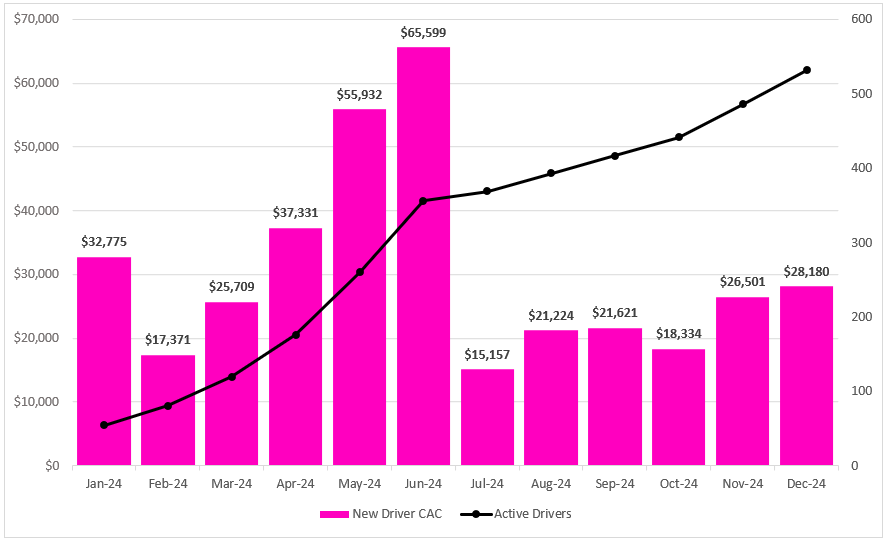
Scenario 2 - Establishing market dominance via aggressive driver hiring, fare reduction and increased commission
In Scenario 2, the projected net revenue for the next 12 months is approximately $1.5MM. Key assumptions include:
Acquiring 15% more drivers to ensure liquidity and reduce rider churn due to the inability to find a driver, resulting in a ratio of 1.15 drivers per 100 bookings
In the first two quarters (Q1 and Q2), Lyft's take rate will be $3.0, with $20 rider CAC and $600 driver CAC, aiming for faster acquisition and market dominance in Toledo
During Q3, Lyft's take rate will increase to $4.5, with $15 in new rider CAC and $500 in new driver CAC, considering the high tourism activity in Toledo during this period. CAC will be lowered to reflect word-of-mouth and network effect
In Q4, fare reduction by 20% and Lyft's commission increase to $6 will be implemented, aligning with the pricing strategy in the marketplace. CAC for both riders and drivers will be lowered to reflect the network effect


(Please refer to the model for more details)
[Bonus] Strategies for market share and profitability
To reduce rider and driver churn - Lyft could implement gamification incentives. For example, offering 10 ride discounts of $5 to riders, valid for 30 days, to boost bookings and retention. Additionally, providing bonuses for drivers who complete 150 rides a month can help reduce churn
To lower CAC - Lyft can leverage referral programs, driving down acquisition costs. As the market matures, Lyft gains pricing power, enabling further reductions in referral bonuses to improve the bottom line
Source: Toledo Express Airport
Source: connecttoledo.org